The After-School Routine That Ends Homework Battles: A Complete Setup Guide for Canadian Families
After school can feel chaotic when kids come home tired and hungry while parents try to balance homework, activities,...
Read More
After school can feel chaotic when kids come home tired and hungry while parents try to balance homework, activities,...
Read More
Getting a pet can be exciting for kids, but it also means learning how to care for another living creature. Different...
Read More
Talking to kids about death is one of the hardest conversations parents face. The key is to use simple, honest langua...
Read More
Getting kids to help around the house can be a challenge. A chore chart system makes it easier by giving children cle...
Read More
Camping with kids can feel overwhelming, but it doesn’t have to be. I’ve learned that the key is breaking down the pl...
Read More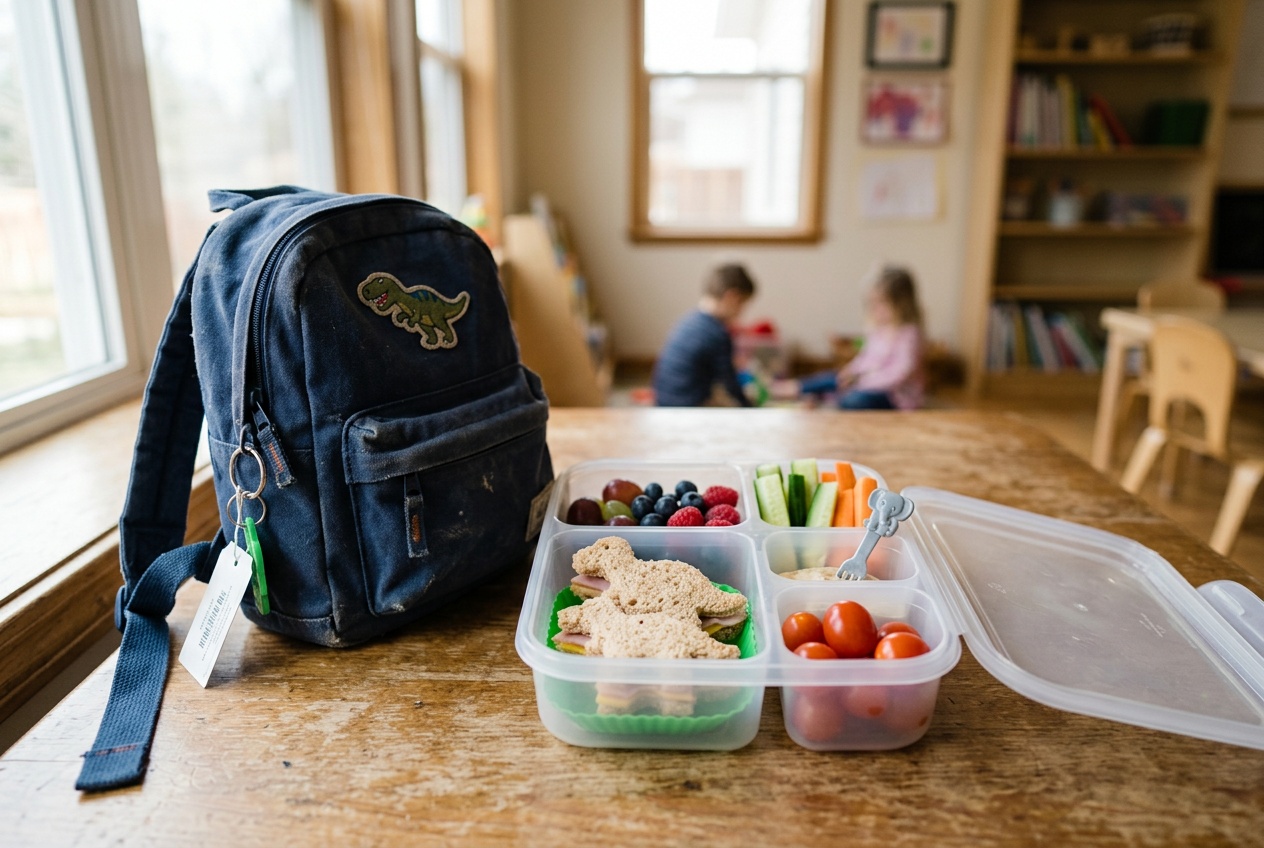
Packing a school lunch doesn’t have to be boring or stressful. Bento boxes let you create fun, balanced meals by divi...
Read More
Parents often wonder which approach works best for raising healthy, well-adjusted kids. Two of the most talked-about ...
Read More
Children face challenges every day, from small disappointments to bigger life changes. Some kids bounce back quickly ...
Read More
A baby wrap is a long piece of soft fabric that you use to carry your baby close to your body. Baby wraps let you kee...
Read More
Giving kids chores helps them learn responsibility and important life skills. But knowing which tasks match their abi...
Read More
Teaching kids about money is one of the most important responsibilities parents have, yet many adults report feeling ...
Read More
Cooking dinner every night feels overwhelming when you’re already stretched thin. Batch cooking lets you prepare comp...
Read More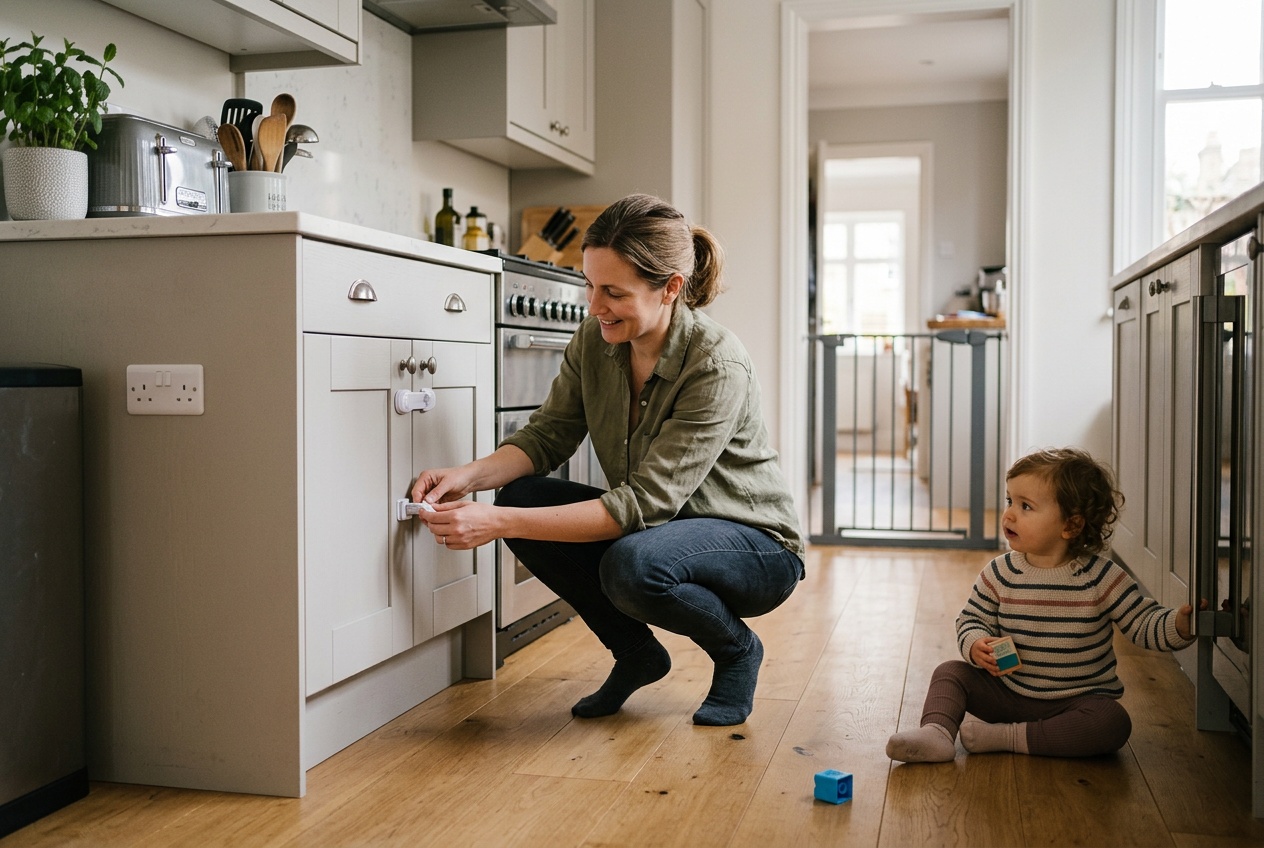
Babyproofing means making your home safe for young children by removing dangers and adding safety measures to prevent...
Read More
Anxiety in children is more common than many parents realize. It affects millions of kids and can show up in differen...
Read More
ADHD is one of the most common brain-based conditions in childhood, affecting how kids focus, control their impulses,...
Read More
Transform your child’s holiday wishes into a treasured family keepsake with this charming handmade ornament
Read More